
Progress as of 09-12-25
I decided to update about every 2 weeks (instead of initially trying to do it weekly).
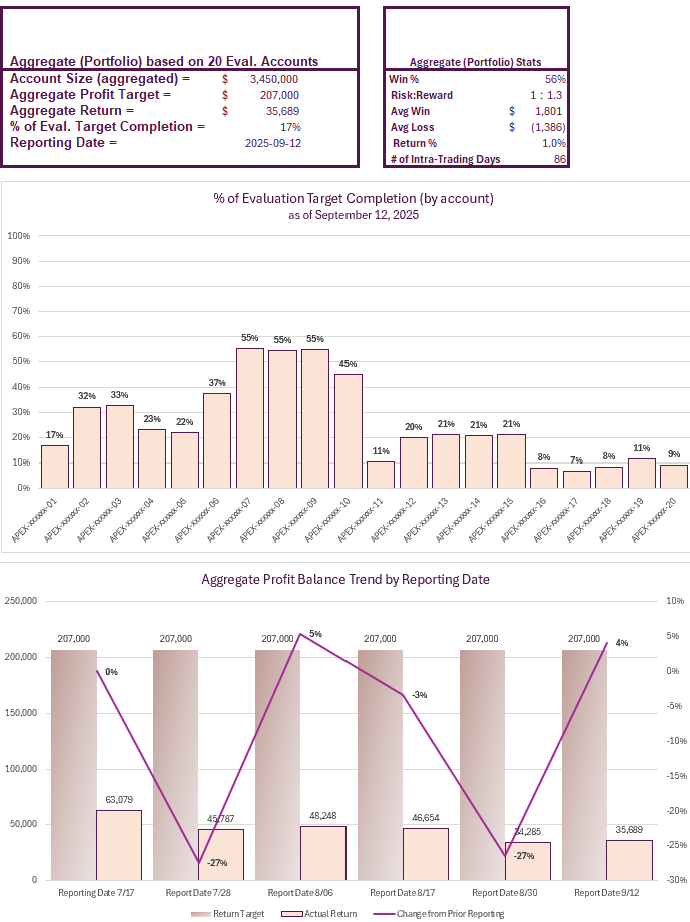
Continuing with the use of these tables/graphs, which I think makes it easier to report out. It may not look like I traded based on my numbers, but I did. At one point my profits dipped down from 34k to 30k. I traded almost every day and worked my way back up to recover those profits back up to 35k. In the past, I would have just “wrote off” those losses and mentally kind of give up for a few days because I felt so down and defeated. But I have learned overtime to pick myself back up quickly and get back in the ring the next day. I feel that every day that I am in, I am learning, as long as I am able to keep my risk management tight. It doesn’t necessarily mean I have to actually trade every day, but just to try to maintain my process and be ready for any opportunities.
So, I am still in the green across all 20 accounts, and up about 1.5k from the last report. I’ll try to find a way in the next report to add another graph to provide some context, like where my highest and lowest points were. Based on the graph below, there are 3 apex accounts that I’ve managed to get to about 55% of the way towards reaching the evaluation profit target.
Below is a screenshot of my Apex Trader Funding Evaluation Accounts on Apex’s platform as of September 12, 2025 (of which the above summarization is based on):
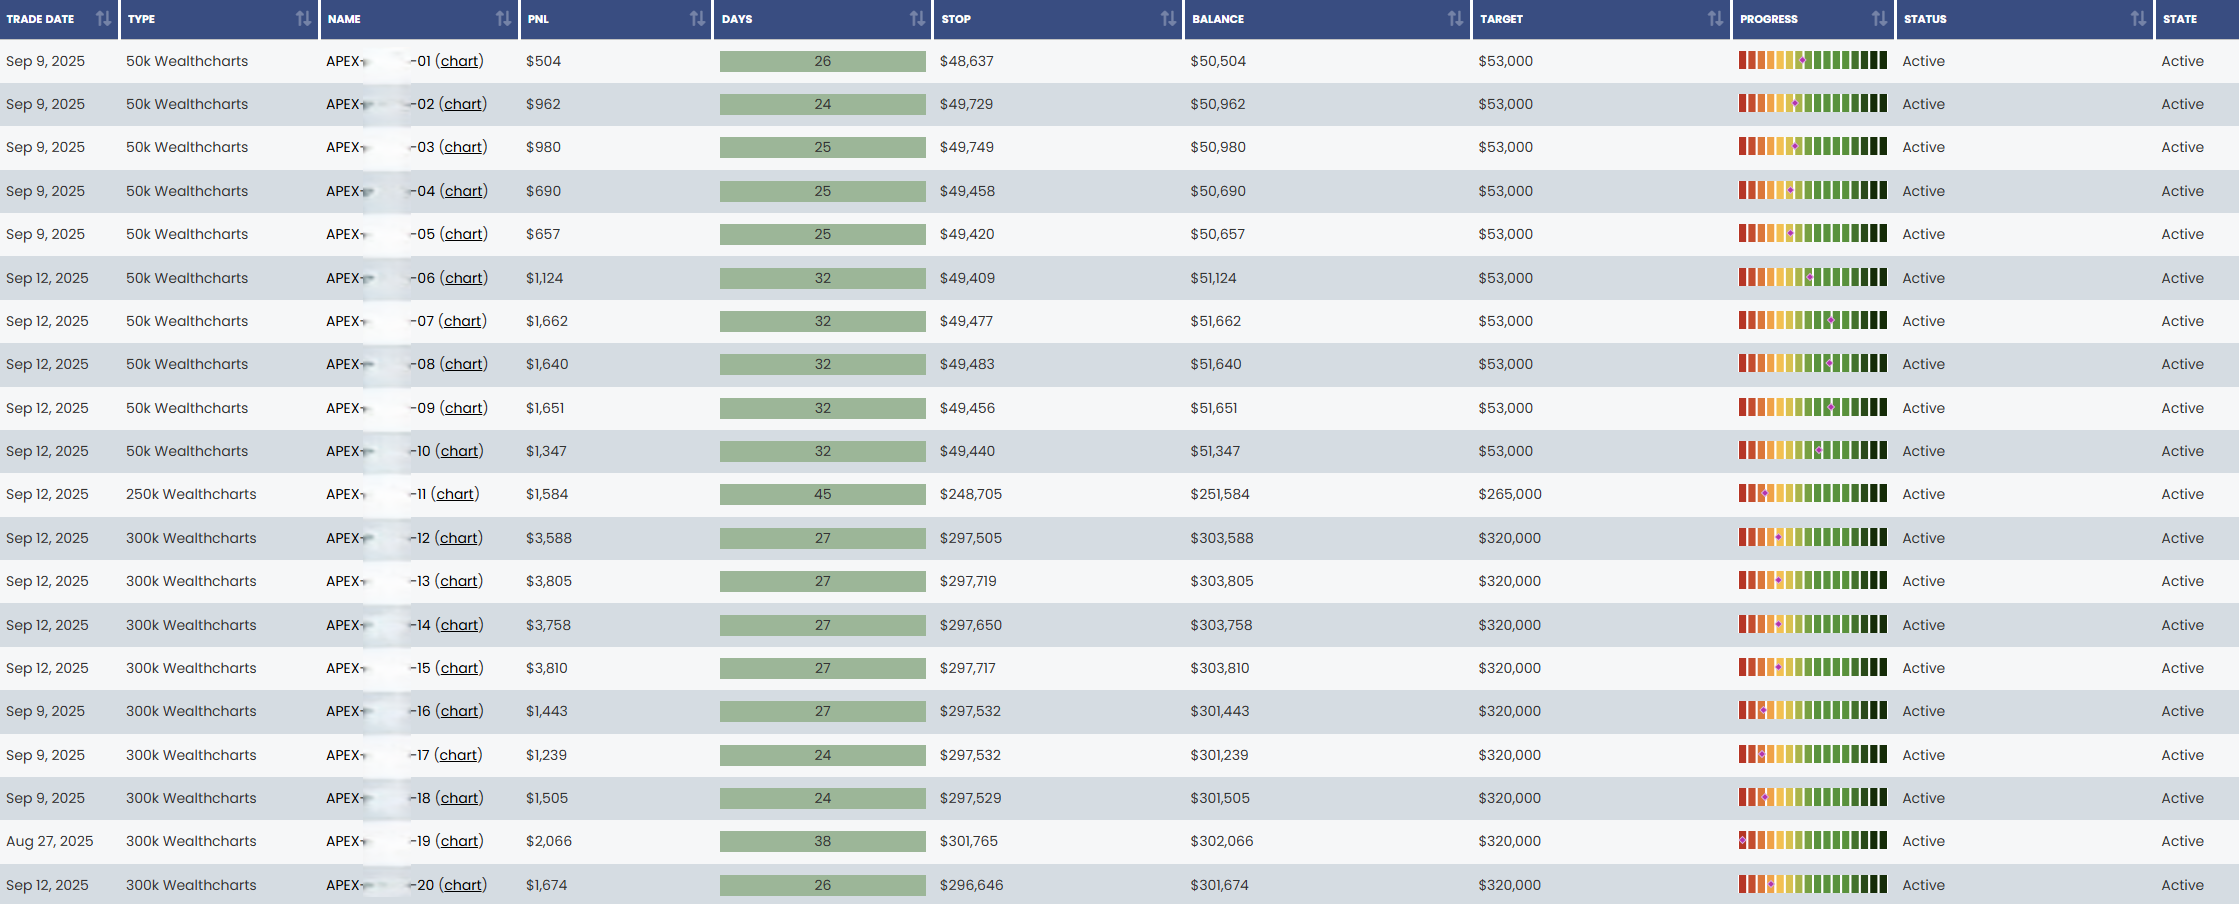
Note: This is a direct screenshot from my Apex Dashboard. My Apex account numbers have been blurred out for security purposes. (To understand how to read these charts, refer to Apex’s explanation on their website.)